Date:
Copyright:
National Center for Biotechnology Information (2023). PubChem Compound Summary for CID 102060393, Austalide C. Retrieved August 1, 2023 from https://pubchem.ncbi.nlm.nih.gov/compound/Austalide-C.
Notes:
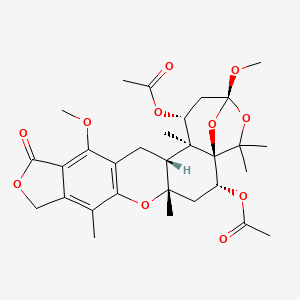
Structure of Austalide C
Images library
-
Title
Legend
-
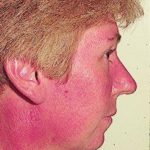
Facial erythema: Voriconazole rash in ABPA patient resistant to corticosteroids, treated with voriconazole 200mg BID. Serum voriconazole levels were very low and the dose was raised to 250mg BID. Within 3 weeks patient had developed remarkable facial erythema. His trough voriconazole concentration at this time was 370ng/ml. When voriconazole was stopped because of the facial erythema and lack of impact on his ABPA his facial erythema resolved over 4 weeks.
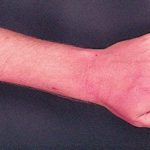
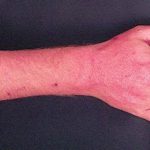
Forearm erythema related to voriconazole. As with facial erythema patient developed remarkable forearm erythema with lesions similar to porphyria cutanea tarda all of which resolved with stopping voriconazole.
 ,
,  ,
, 
-
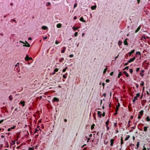
Eosinophilic mucin containing numerous eosinophils and Charcot-Leyden crystals (arrow). Stain PAS x400. Patient with allergic fungal sinusitis
-
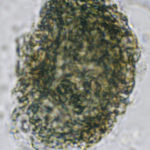
A whole fungal ball removed from the sinus by endoscopic surgery. No staining x 10
-
Crushed fungal material removed from sinus by endoscope. No staining x40

-
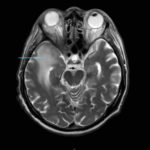
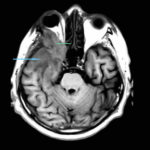
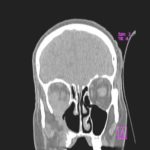
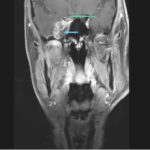
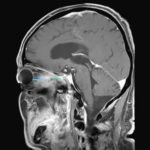
This 68 year man with a history of hypertension and ischemic heart disease presented with nasal obstruction, localised swelling and pain in his right cheek for about two months. CT scan showed a soft tissue mass filling the right maxillary sinus adjacent to the floor of the orbit. Maxillotomy with mass removal was performed and culture grew A. fumigatus. Histology was not performed and the patient received no antifungal therapy. 5 months later localised relapse with progression along the medial wall of the orbit was seen on CT scan.
 ,
,  ,
,  ,
,  ,
,  ,
, 
-
Yamik catheter for rinsing nasal and paranasal cavities. Image D

-
Yamik catheter for rinsing nasal and paranasal cavities. Image C
